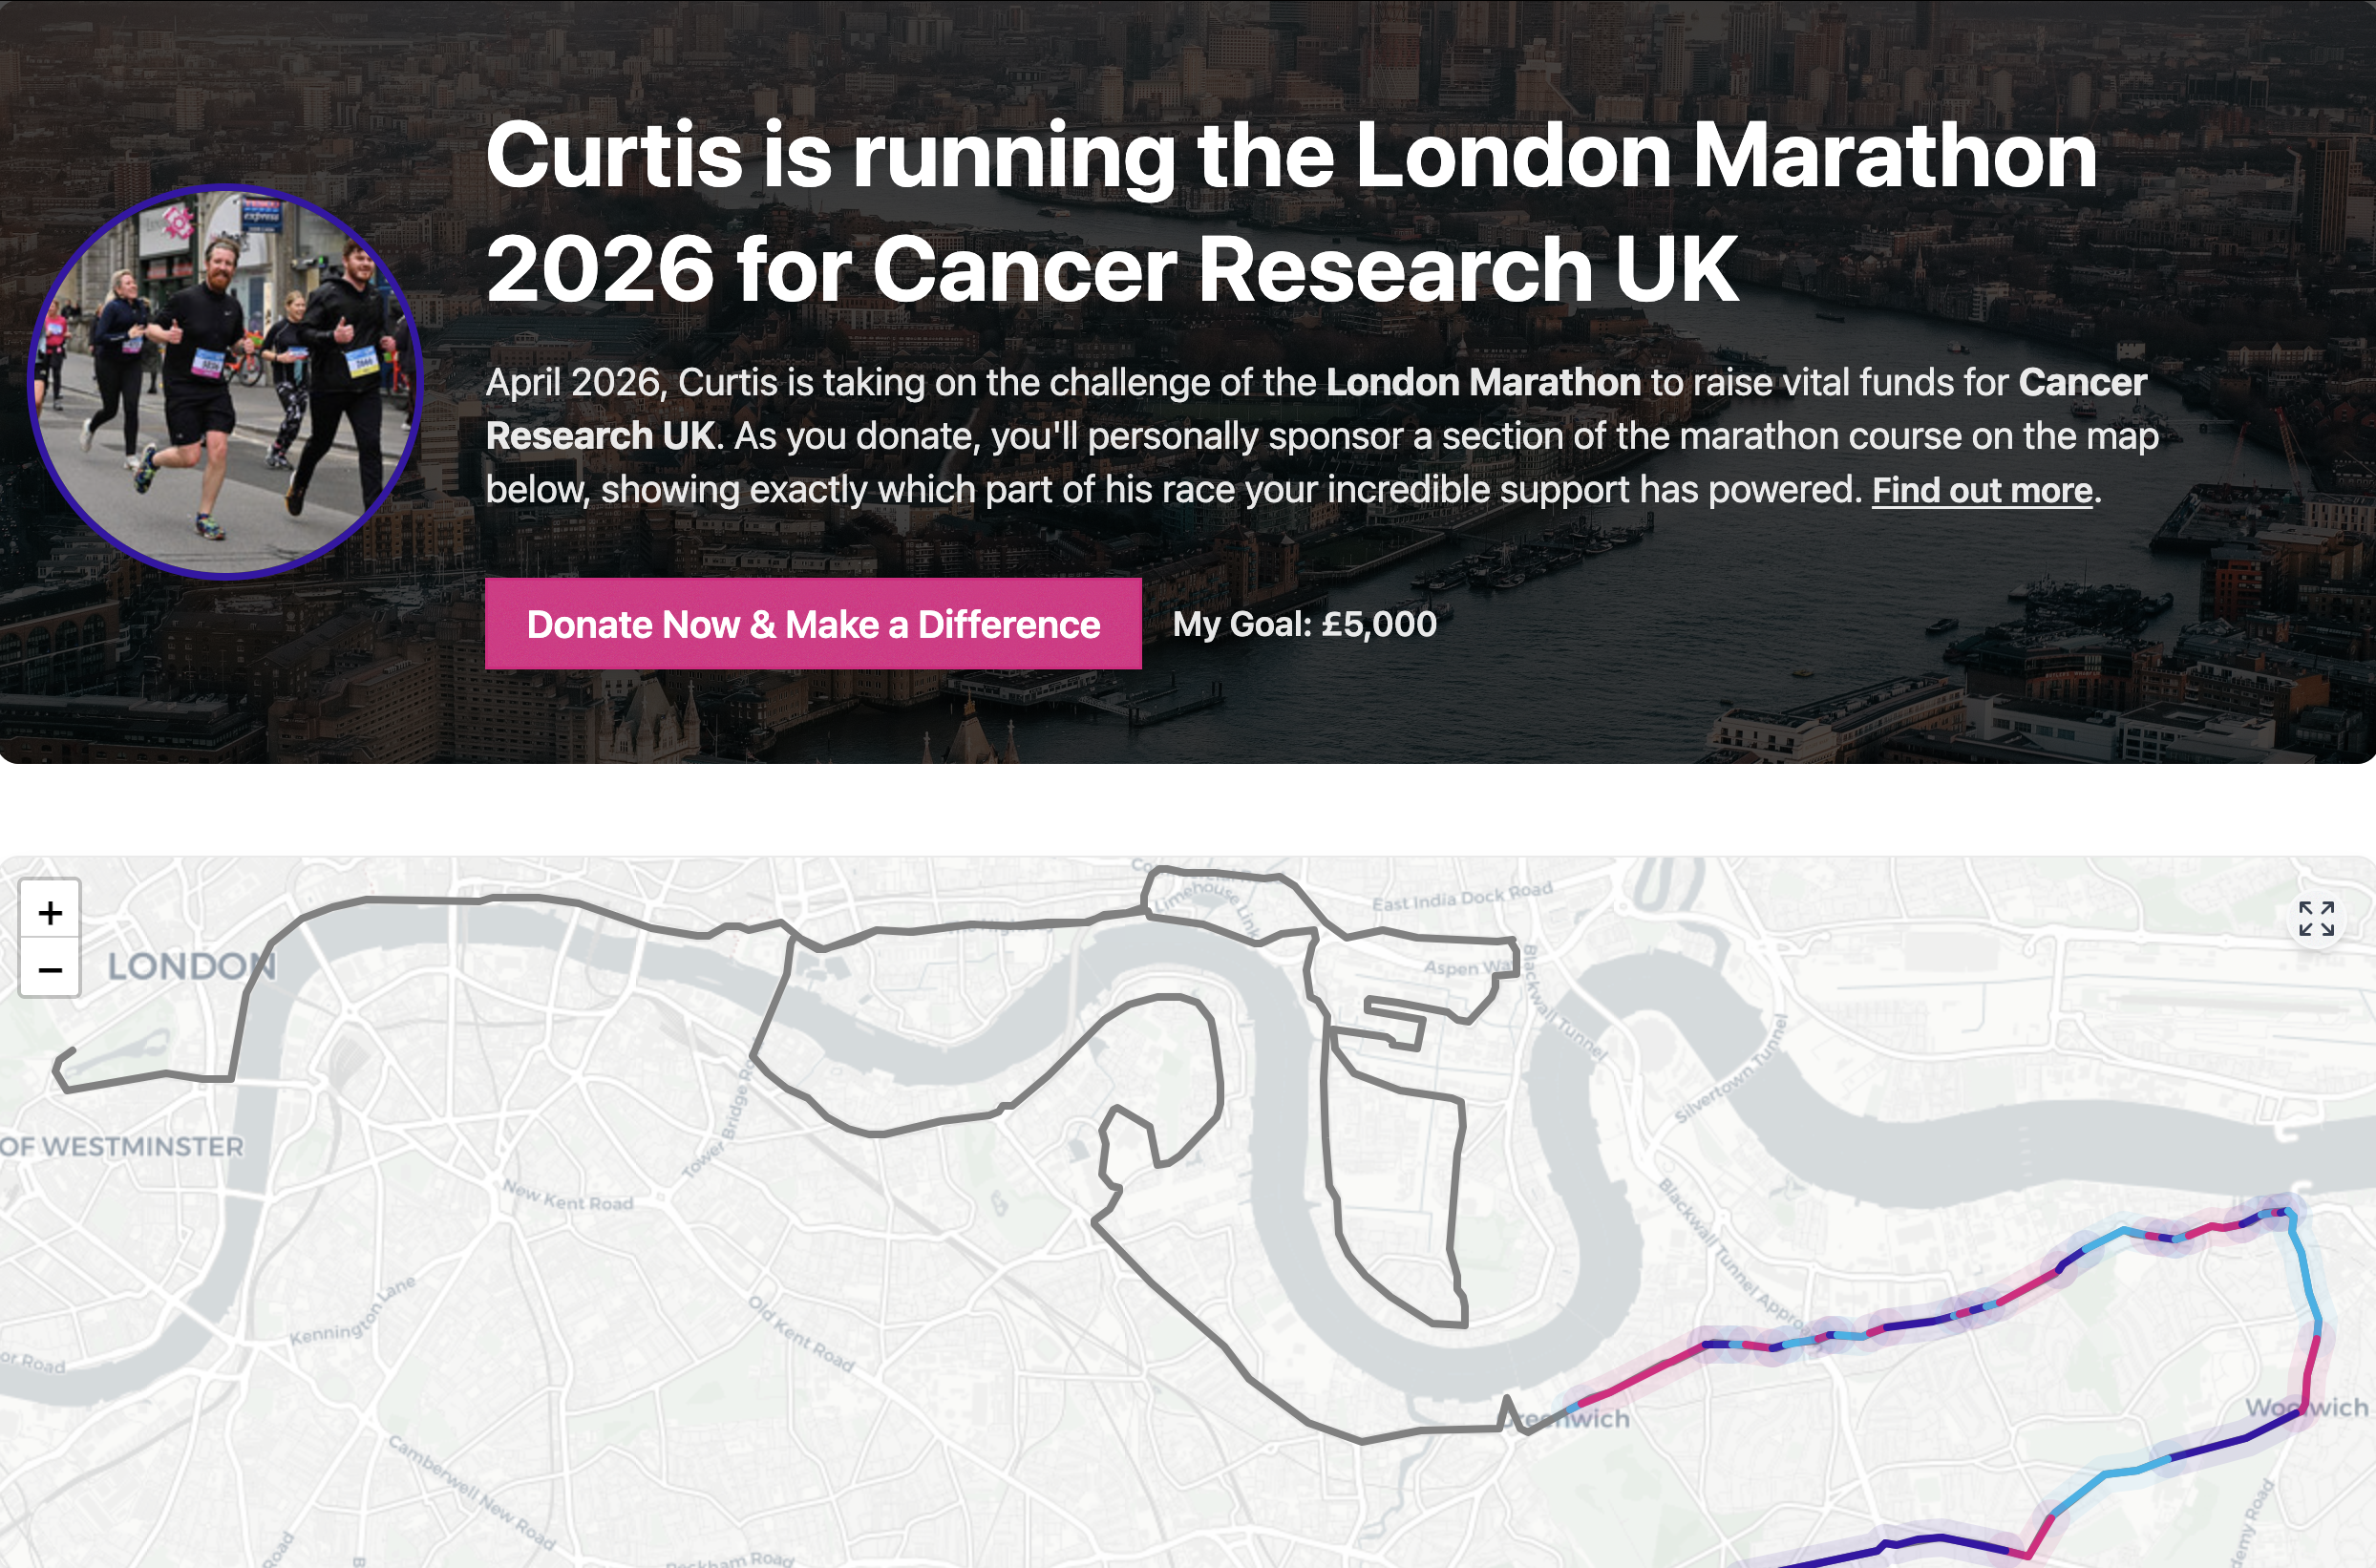
Turning my London Marathon fundraiser into a sponsorable route
👉 View the site & sponsor a segment, helping raise funds for Cancer Research UK
Most marathon fundraising pages follow the same formula. You donate, a progress bar nudges forward, and your name appears in a list somewhere below. The total increases, but your individual contribution quickly disappears into the aggregate.
Back when I first started preparing for the London Marathon a few years ago, I wanted to experiment with something more tangible. A fundraising site where every donation left a visible, permanent mark. Something that donors could point to and say "that part is mine".
This post is a technical case study of how I built a fundraising website that turns the marathon route itself into the progress bar. Donations don't just increase a number - they claim and colour sections of the course, complete with the donor's name and contribution.
Core requirements
Before thinking about implementation, I was clear on a small set of requirements:
1. Use an existing, trusted fundraising platform.
I had no interest in building a payment system. Handling payments, donor data, and compliance correctly is a hard problem, and it's not where this project needed to be novel. Instead, the site integrates with the JustGiving API.
That choice was based on the following benefits:
- Donors are already familiar with the platform, which increases their confidence in donating
- Payments are handled securely without my system needing to touch any card data
- Funds go directly to Cancer Research UK, not via an intermediary account
- The API provides reliable access to donation data for visualisation
This let me focus entirely on the modelling and interaction, while delegating the hard financial problems to a system that already solves them well.
Also, whenever I faced any issues or questions with the JustGiving API, their team were very quick to provide helpful support!
2. Make the route itself the interface
The marathon route needed to be more than a static visual. At a minimum, this meant the route needed to:
- React to click interactions
- Update incrementally as new donations arrived
3. The route must be clearly segmented
Finally, the segmentation itself had to be obvious.
Donors needed to be able to:
- See where one sponsored section ends and another begins
- Understand how much of the route a donation covered
- Recognise continuity along the course as it filled in over time
Early Prototype: Canvas API
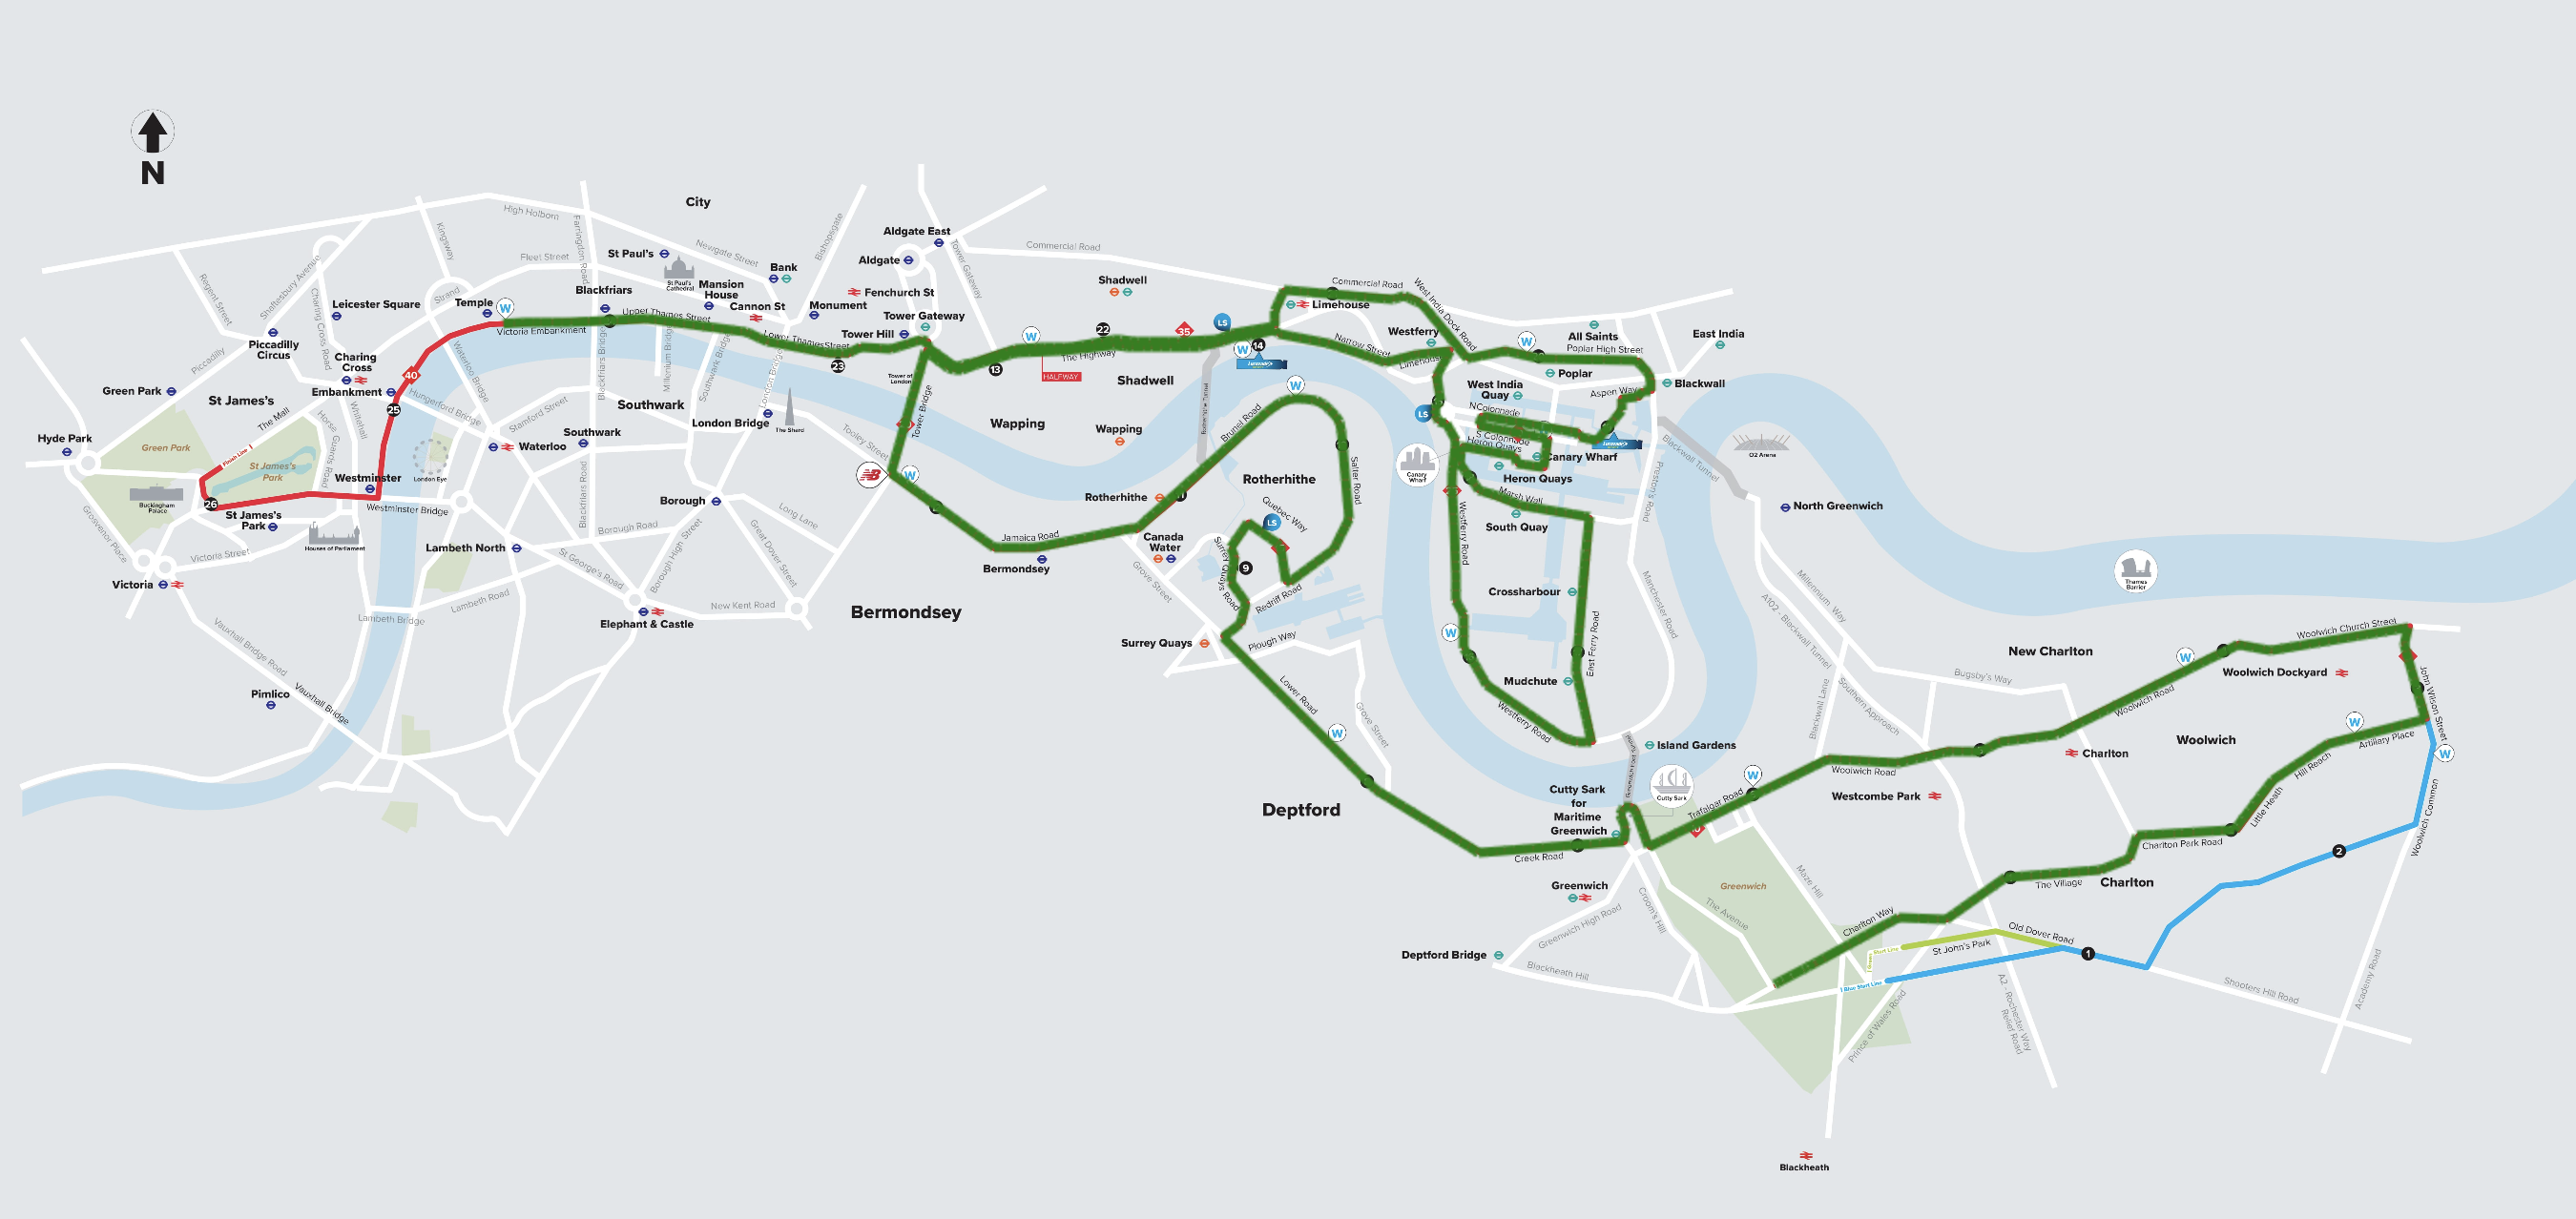
With those requirements in place, the first version of the map was built using Canvas API.
I started with a static image of the marathon course as the base map and drew a single polyline over the top to represent progress along the route. Even at that early stage, the visual idea worked. Seeing part of the course filled in immediately conveyed the concept more clearly than a progress bar could.
However, it became obvious that scaling this approach would be difficult. The route only existed as pixels on a canvas, and any interaction would have had to be custom-built on top. If the route was going to be interactive, segmentable, and stateful, it needed to be treated as data rather than something that was drawn onto a canvas.
That led to the move away from Canvas entirely.
Moving the route to Leaflet
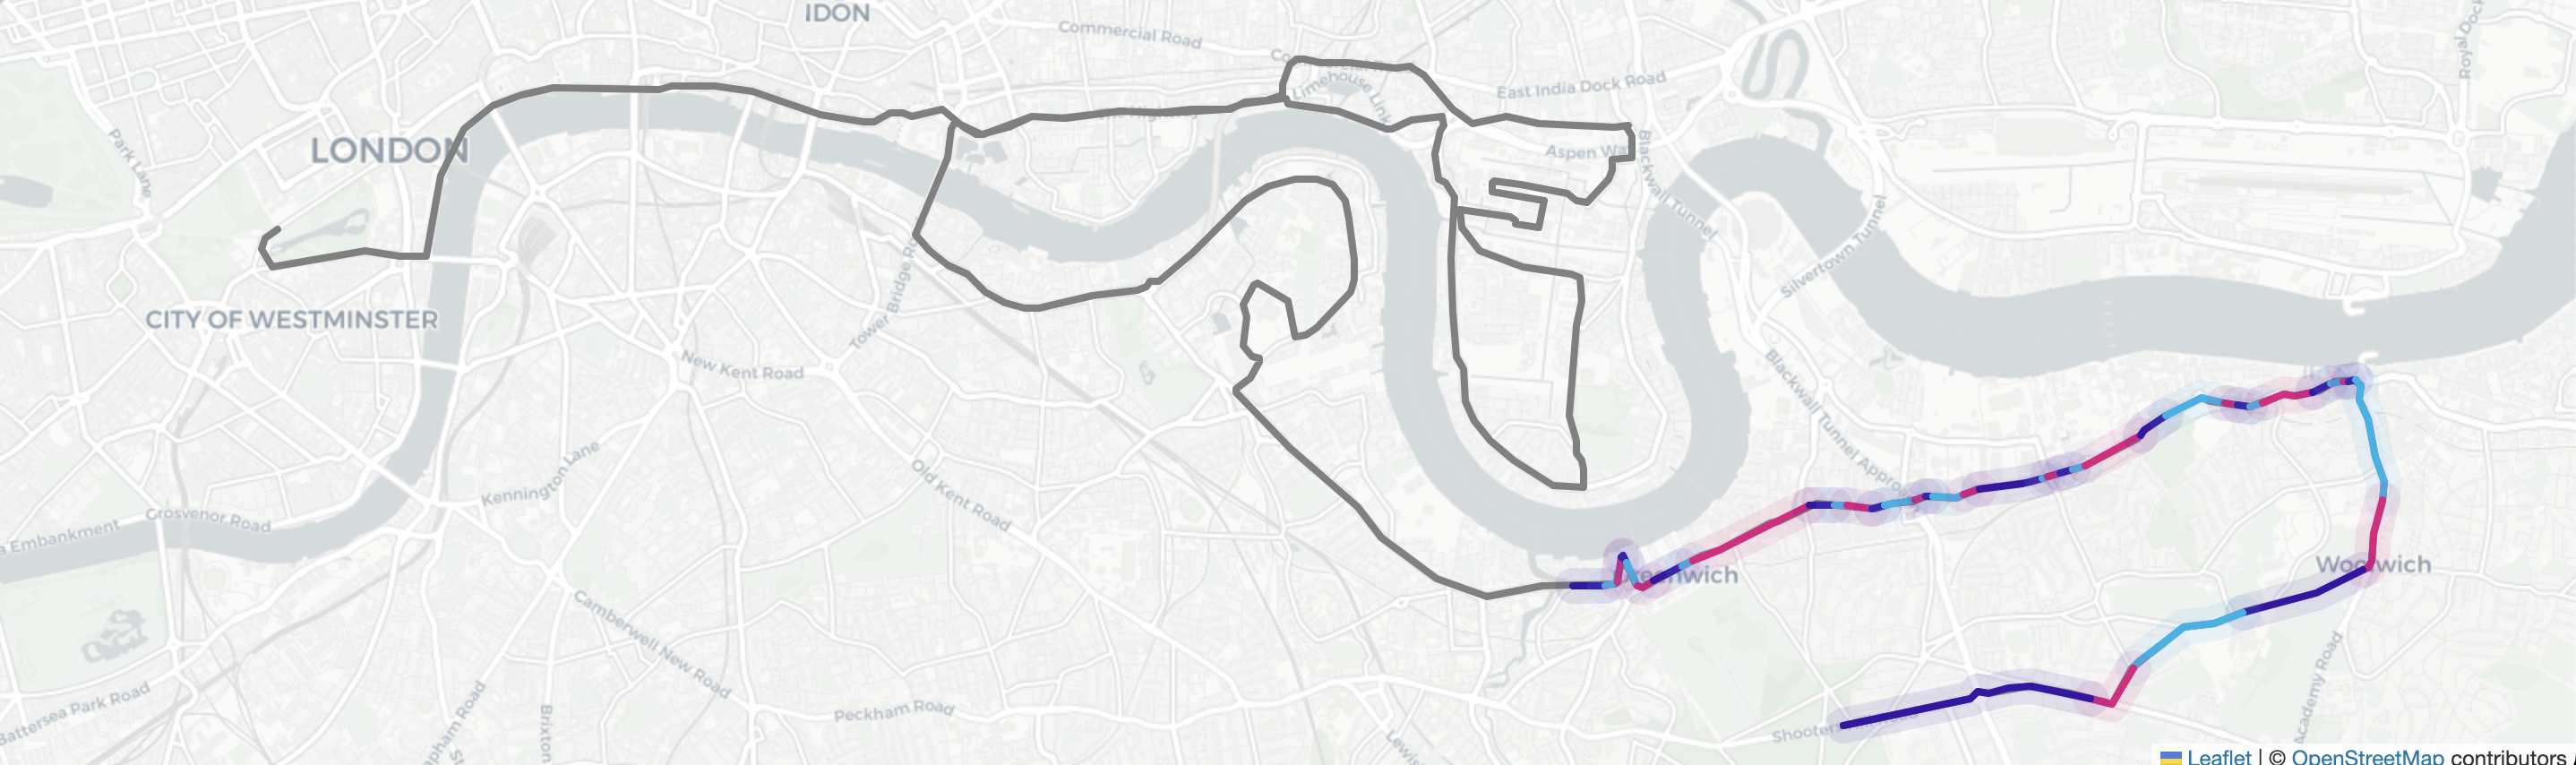
Instead of drawing the marathon course onto a canvas, I moved to plotting out the route using Leaflet. This came with a few clear benefits:
The route could be presented as data rather than a static image
- With canvas, I was simply plotting lines onto an image. With Leaflet, I was plotting coordinates onto a map. That meant core functionality, such as panning and zooming, came out of the box, rather than needing to be built from scratch.
Improved rendering
- In the early canvas prototype, there were some visible issues with line rendering. These problems disappeared when moving to Leaflet, which handles line rendering far more robustly as part of the mapping abstraction.
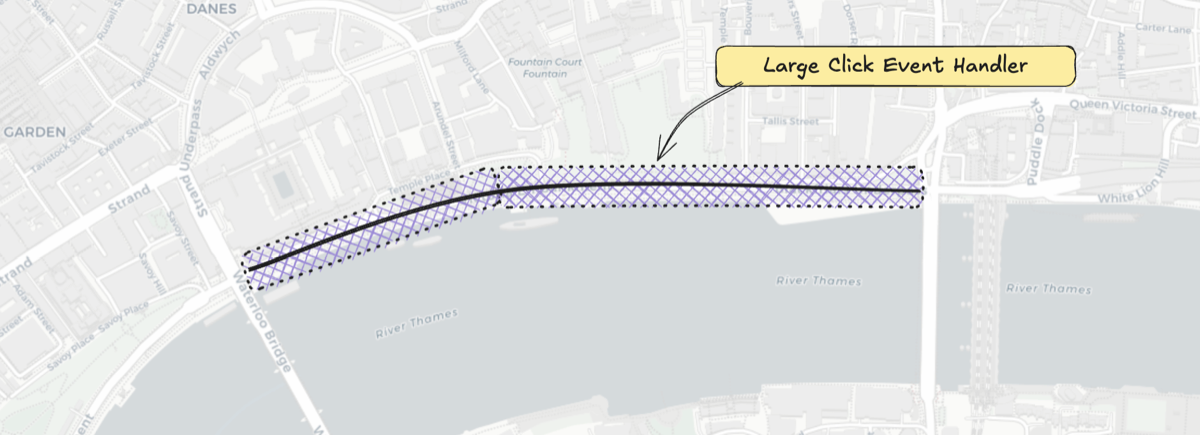
Interaction
- Polyline interaction comes out of the box with Leaflet, and therefore it made it much simpler to be able to add click event handlers for showing additional information about specific donations.
This all made it possible to think about the course in terms of allocation rather than drawing. Donations could now map onto parts of a real path, and those parts could be rendered, updated, and interacted with consistently as the state of the fundraiser changed.
Segmenting the marathon by donation value
The fundraising target is £5000, and the marathon distance is 26.2 miles (42.195km).
That gives a simple conversion:
- £1 ≈ 0.00844km
- £500 = 4.22km
Each donation is converted into a distance, and that distance is allocated sequentially along the route.
There's no ability to choose a specific location. Donors simply pick up where the previous allocation ended. Over time, the route fills in from start to finish.
This keeps the system deterministic and avoids edge cases around prioritisation or conflicting claims.
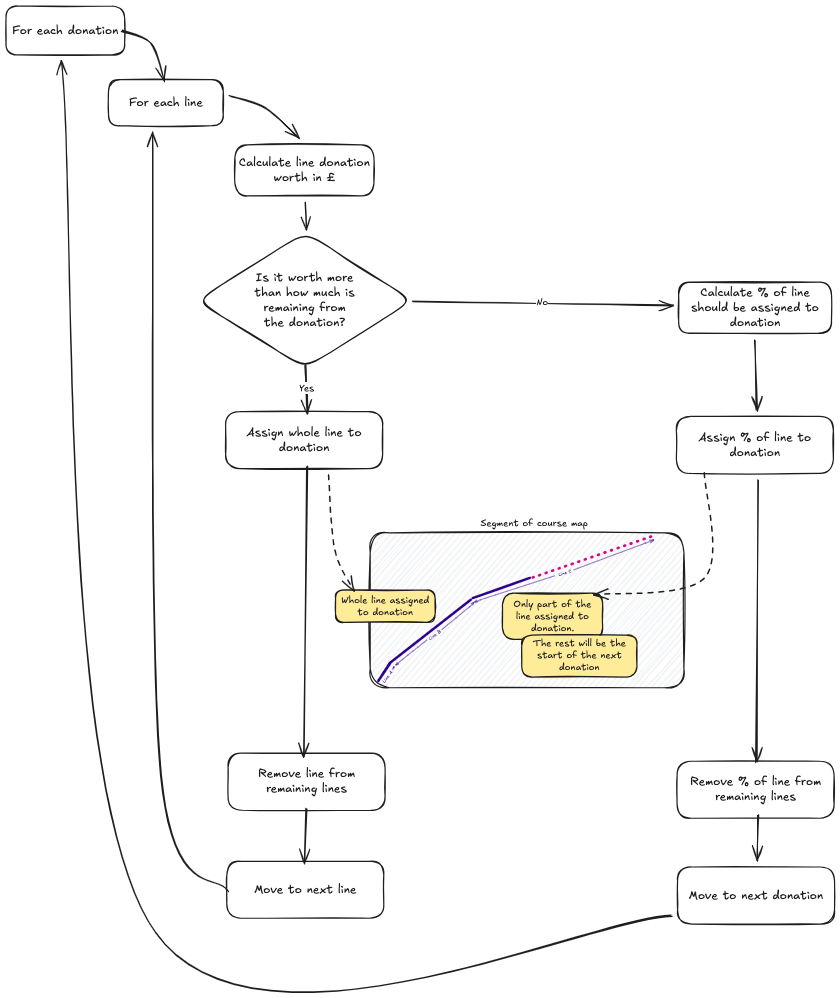
Mapping Donations to Route Segments
Donations are processed in chronological order. Each donation is converted into a number of segments based on its value, and those segments are allocated sequentially along the route.
At a high level, the flow looks like this:
- Fetch all donations from the JustGiving API
- Sort them by timestamp
- Convert each donation amount into a distance
- Allocate that distance along the remaining route
Once a segment is claimed, it's permanently associated with that donor. If someone donates later, they simply pick up where the previous allocation ended.
This creates a clear, mapping between donation data and the visual state of the route.
Tech Stack
The site is built with a simple, modern tech stack:
- Next.js - Handles data fetching and static generation
- TypeScript - Important for modelling donation data and route segments, with confidence
- Leaflet - Used for rendering the marathon route on a map
- DaisyUI - Allowed me to create quick UI components without much overhead
- Netlify - Provides simple and reliable hosting
Why this model works for fundraising
What surprised me most was how effective this model is psychologically.
Donations don’t just increase a number — they claim territory. Contributors can point to a specific section of the course and say “that bit is mine”. One family member, who has generously donated, is even planning to come along on the day and support me from their segment of the route.
It also makes smaller donations feel meaningful. Even modest contributions permanently colour part of the map, giving donors a lasting, visible presence on the course.
Current Drawbacks
- Part of the marathon map, specifically around Tower Hamlets, doubles back on itself. I need to figure out a way of handling this so that donations are not stacked on top of one another. Luckily, the marathon route is only 1 lap, or else I'd have other problems, which leads onto my next steps below.
- If I'm lucky enough to succeed the £5000 goal, there is currently no plan for the donors beyond that point. It would be nice to find a way of representing them too, without taking away from existing donors.
Next Steps
As with all personal projects, there is always more that can be done! Here are a few of the ideas I've got in mind:
- Currently the site is very fixed to my marathon fundraising. It would be great to allow other runners to use the model for their own fundraising, on different running courses
- Allow donors to be able to easily share their segment with social media. Currently there's no way of doing this, other than screenshotting, which isn't ideal.
- April 2026 Update: This is now possible via a "Share" link in the donation modal
- Some donors have suggested they would donate more for more premium spots on the route (for example, Tower Bridge). I'd like to find a way of incorporating this idea
- Better interaction between JustGiving -> Donation Site. Once the donation is made, via JustGiving, the donor must find their own way back to the site, and refresh the page, to then see their donation on the map. It would be nice to give more instant gratification here with an immediate display of their donation segment.
- Caching of segmentation allocation for performance gains
Visit the site & sponsor a segment!
If you'd like to see the site in action, or sponsor a segment of the route yourself, you can do so here:
https://londonmarathon.curtiscode.dev
Every donation directly supports Cancer Research UK and permanently claims a piece of the course.